Interactive
Dashboards
Interactive tools built on our data and models, so you can explore the numbers and see
what moves for yourself.
-
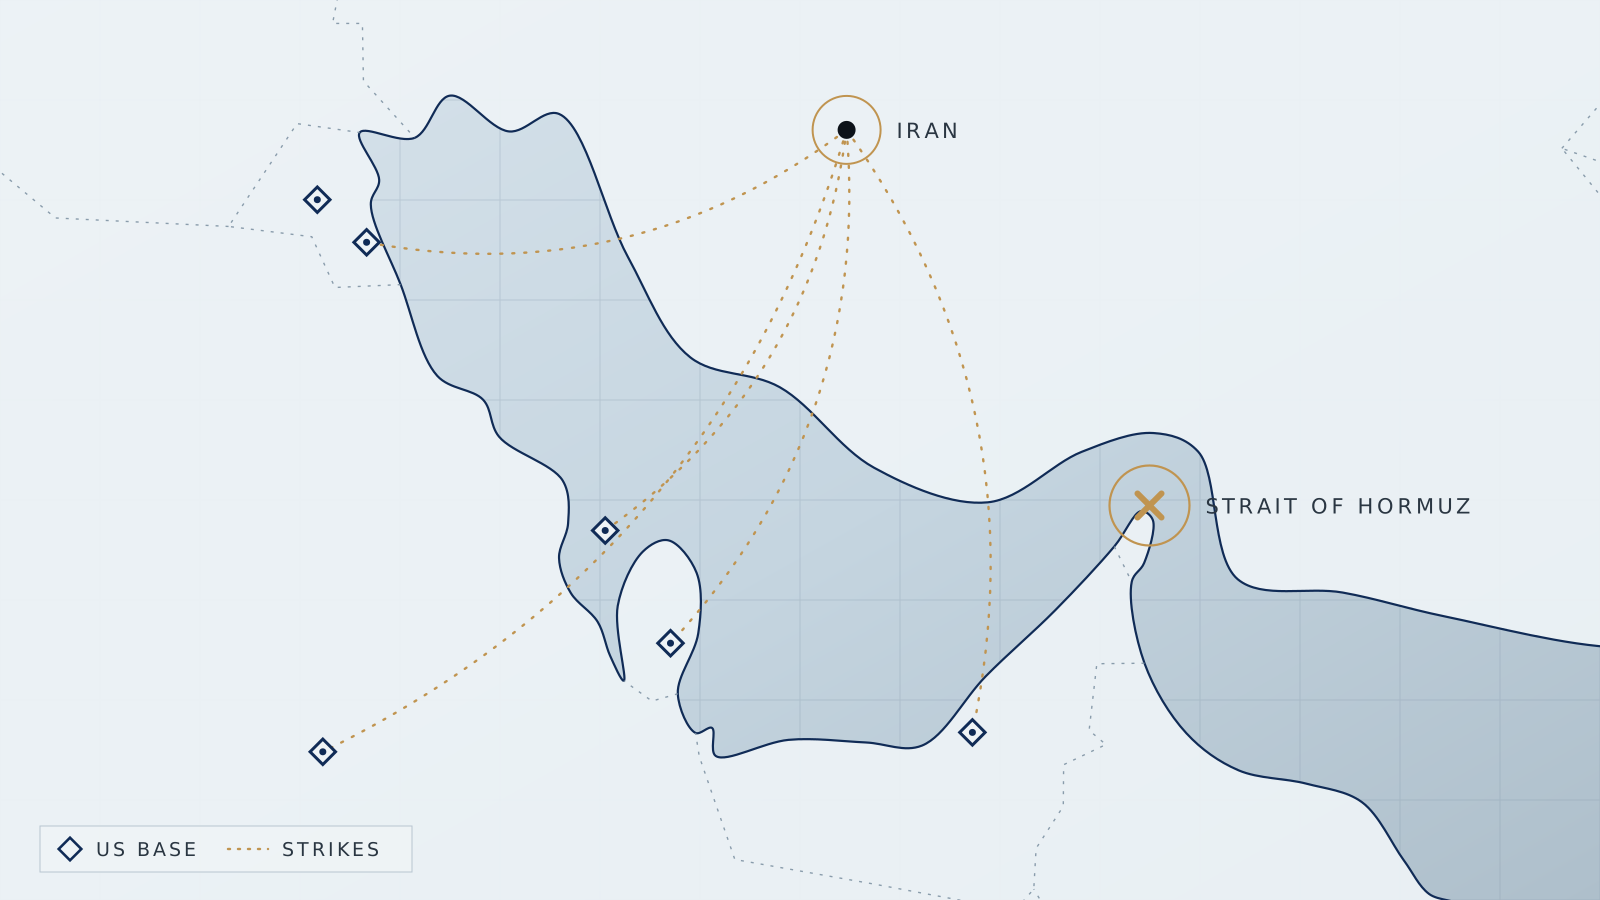
Working paper · November 2026
The US/Israel–Iran war: the economic costs of a continued conflict
Interactive results behind our study of the 2026 US/Israel–Iran war: GDP, trade,
industries and prices for each economy from 2025 to 2030, if the war ends in 2026
or goes on into 2027.
- Years
- 2025–30
- Regions
- 12
- Scenarios
- 2
- Models
- 2
-
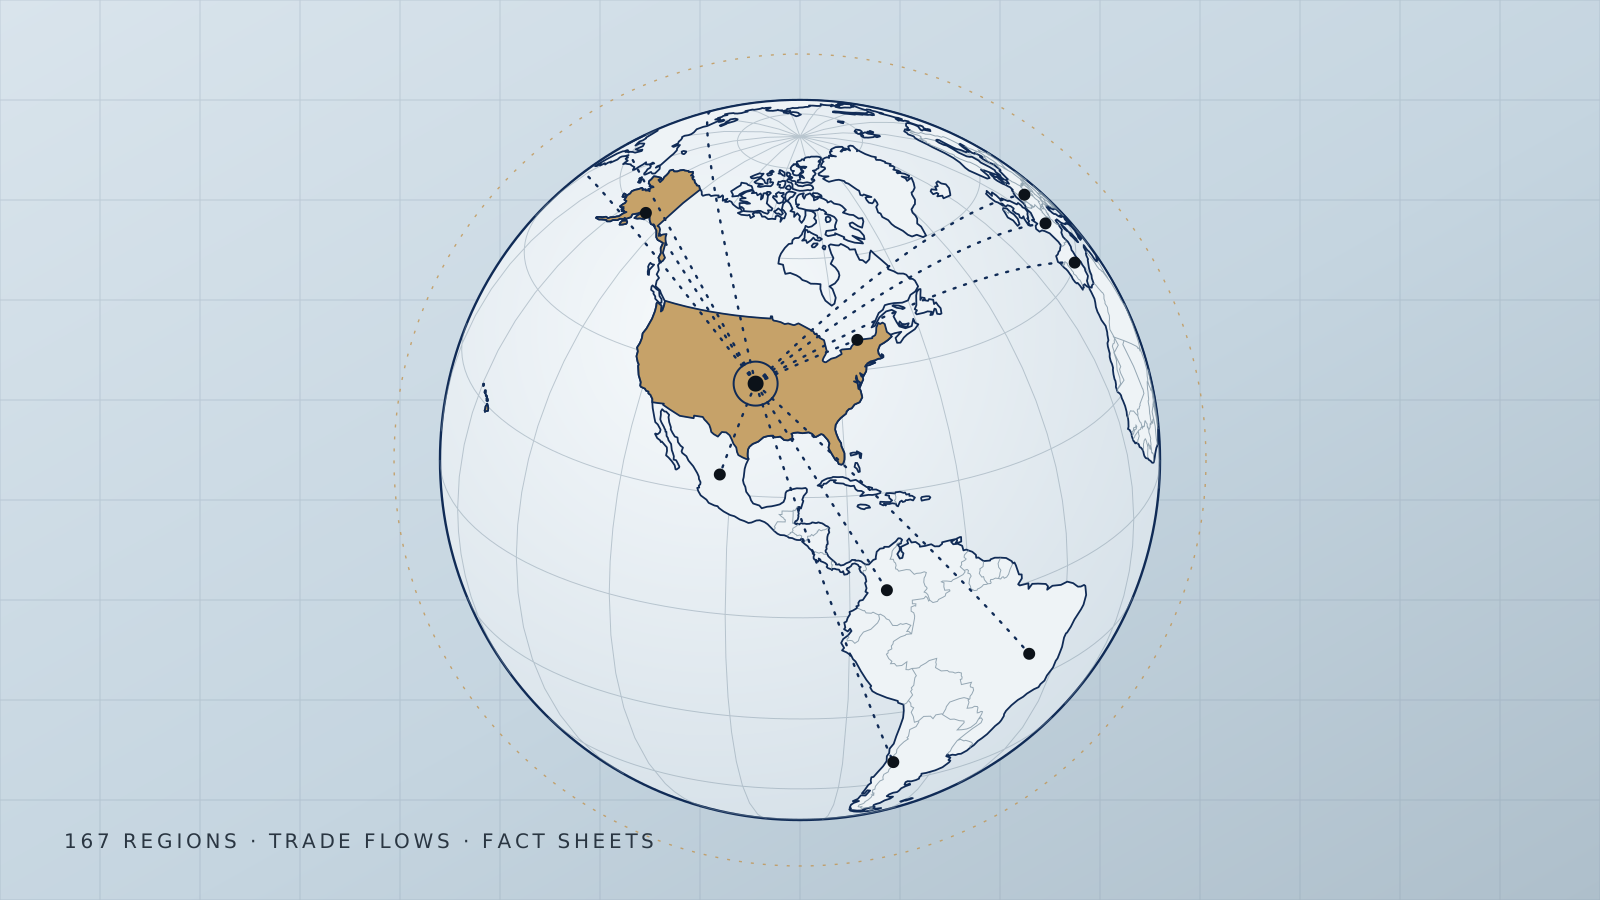
OCGE Database beta v5.5
OCGE Explorer
Explore the OCGE Database on a 3D globe: trade flows between 167 countries and
regions, a map of how much each economy relies on any sector, and a fact sheet for
every country with the make-up of its economy.
- Data year
- 2022
- Regions
- 167
- Sectors
- 51
- Views
- 3
- Downloads
- CSV
More dashboards will follow here as we publish new work.